
How Long Does It Take to Sell a Home in Rancho Santa Fe?

Updated November 2026
In ZIP 92067, a Rancho Santa Fe single family home that closed in the last 12 months spent an average of 65 days on the market, and the median for October 2026 was 69 days (10 closings), according to San Diego MLS market statistics. Add escrow and most sellers should plan on roughly three to four months from going live to closing. Your own number can differ widely: the monthly median has ranged from 9 days to 94 days in the past year. Pricing against competing homes is what I would look at first.
I am Zach Arrington, Broker Associate with Real, and I track the 92067 market closely as part of my work along the North County coastal corridor. Below is what I would show an owner deciding when to list: 12 months of closings, how that compares with San Diego County, and why the figures you see online for Rancho Santa Fe disagree with one another.
What the last 12 months show
On average, a 92067 home takes about twice as long to sell as a home in San Diego County. Over the 12 months through October 2026, the average in 92067 was 65.0 days against 31.7 for the county, and sale prices landed further below list.
| Single family homes | 92067, Nov 2025 to Oct 2026 | 92067, Nov 2024 to Oct 2025 | San Diego County, Nov 2025 to Oct 2026 |
|---|---|---|---|
| Closed sales | 165 | 154 | 15,256 |
| Average days on market | 65.0 | 69.1 | 31.7 |
| Middle value of the 12 monthly medians | 39.5 | 59 | 14 |
| Lowest and highest monthly median | 9 and 94 | 14 and 111 | 11 and 23 |
| Sale to list price ratio, weighted by closings | 96.2% | 95.0% | 99.6% |
How I built this: I pulled each month from the San Diego MLS market statistics tool for ZIP 92067 and for the county, then weighted each month's average days on market and sale to list ratio by that month's closed sales. The tool rounds the monthly ratio to two decimals, so treat that row as approximate. A true 12 month median needs individual sales, which the tool does not publish, so I show the middle of the monthly medians instead. Average sale price later in this post is total sale volume divided by closings.
Closed sales rose 7.1% from the prior 12 months, while new single family listings fell 16.9%, from 326 to 271. That is a modest improvement, not a fast market.
Why the average and the median tell different stories
The average runs higher than the median because a few very slow sales pull it up. In 11 of the last 12 months, the 92067 average was above the median. September 2026 is the clearest case: 19 closings with a median of 37 days and an average of 95.
That gap is the part of this market most sellers miss. Half of the homes in a month can sell fairly quickly while others sit for many months. I look at both figures rather than quoting the better one.
Why you see so many different numbers online
Published figures for Rancho Santa Fe differ because they measure different places, property types and time periods. Redfin, for example, shows a median of 81 days on its Rancho Santa Fe page for September 2026 across all home types. The San Diego MLS tool shows 37 days for September 2026, but only for single family homes in ZIP 92067.
The definition matters too. San Diego MLS support documentation describes Days on MLS as the time a listing was active, and it leaves out days when the listing was withdrawn or pending. Its separate Market Time figure runs from the listing date to the close of escrow, again leaving out those days. The public tool labels its figure Median Days on Market and does not say which field it uses, so I treat it as a measure of market exposure and add escrow separately. A listing pulled for a few weeks and brought back can look faster than the owner's actual experience.
Is there a best time of year to list?
Closings since January 2024 do not show a season you can count on in 92067. The second quarter of 2026 was unusually quick, but the same quarter averaged more than 70 days in both 2024 and 2025.
| Closing quarter, 92067 single family | 2024: average days (closings) | 2025: average days (closings) | 2026: average days (closings) |
|---|---|---|---|
| January to March | 66.0 (32) | 78.2 (36) | 71.3 (33) |
| April to June | 71.2 (46) | 72.4 (37) | 37.3 (39) |
| July to September | 50.4 (40) | 62.6 (49) | 68.3 (50) |
| October to December | 62.2 (30) | 76.2 (50) | October only: 95.0 (10) |
Each quarter is small, and a spring closing may reflect a winter listing. New listings do follow a pattern, peaking from April to June each of the past three years, so a spring seller generally has more company. I would pick a list date around when the home is truly ready.
Where the market stands right now
Going into winter, 92067 has more months of supply than the county. In October 2026, 92067 had 73 single family homes in inventory and 10 closings, with a median sale price of $5,272,500. Dividing that inventory by the 12 month pace of about 13.75 closings per month gives about 5.3 months of supply, compared with about 2.4 for the county by the same math.
The median active listing in 92067 had been on the market for 100 days in October, and only 14 new single family listings came on, against 34 in October 2025. October's 94% sale to list ratio compares with 95% a year earlier. October's 10 closings are a small sample, and a recently ended month can still be revised, so I would not draw a trend from it alone.
What this means if you are selling
Build your plan around the slower case, and let a faster sale be the upside. Here is the simple timeline I would sketch using the 65 day average and an example escrow; your contract sets the real one.
| Stage | With a 30 day escrow | With a 45 day escrow |
|---|---|---|
| Days on market (92067 12 month average) | 65 | 65 |
| Escrow (example only) | 30 | 45 |
| Total from going live to closing | 95 days | 110 days |
This excludes preparation time and is a planning example, not a promise. In my judgment, a home with few direct comparisons can take much longer.
Before listing, I would check three things for the specific property:
- Your real competition. The tool does not break out price tiers, so a ZIP average cannot tell you how your price point is moving. Pull recent closings and active listings near your price and on similar land.
- The price gap you are accepting. As an illustration, a $5,272,500 sale at a 94% ratio implies a list price near $5,609,000, a gap of about $337,000.
- Your deadline. If you need to close before buying elsewhere, or by a set date, plan backward from the slower case.
What this means if you are buying
A long market time gives you a question to ask, though it does not by itself mean a home is overpriced or flawed. Ask for the listing's history, including any time it was withdrawn and relisted, because the days on market shown may not capture the full story. For carrying costs once you own, see my breakdown of the Rancho Santa Fe property tax rate and what a buyer will pay.
Where these numbers apply and where they do not
These figures cover single family homes in ZIP 92067 unless noted, and ZIP codes do not match neighborhood lines exactly. A 92067 address does not tell you whether a home is inside the Rancho Santa Fe Covenant, in a separate gated community, or elsewhere in the ZIP, and the tool does not separate them. ZIP 92091 is much smaller: 26 single family closings over the same 12 months, averaging 49.5 days, with fewer than 10 closings in every month, so I would not rely on it for a trend. Condos and townhomes are thin too, with 5 closings in 92067 and 18 in 92091. The tool's figures can change as records update.
If you are weighing a sale in Rancho Santa Fe, I am happy to walk through the closings that compare with your home. I'm Zach Arrington, and you can call or text me at (619) 374-5339 or email zach@zarealtygroup.com.
Related: What does the FAIR Plan's rate hike mean for Rancho Santa Fe homeowners?
Frequently asked questions
How long does it take to sell a house in Rancho Santa Fe?
In ZIP 92067, single family homes that closed from November 2025 through October 2026 averaged 65 days on the market, per San Diego MLS statistics. With a 30 to 45 day escrow, that is about 95 to 110 days from going live to closing. Individual homes can take far more or less time.
How many days is considered long for a house to be on the market in Rancho Santa Fe?
There is no official cutoff, but the local baseline is much longer than the county's. The 92067 average over the last 12 months was 65 days, compared with 31.7 for San Diego County. Rather than judging a listing against a county figure, compare it with similar homes nearby at a similar price.
What is the hardest month to sell a house in Rancho Santa Fe?
The data does not point to one. Since January 2024, averages for complete quarters in 92067 ranged from 37.3 to 78.2 days with no repeating seasonal pattern, and each quarter is a small sample. Closings also lag listings, so these figures do not tell you which listing month works best.
Do luxury homes take longer to sell in Rancho Santa Fe?
Homes in 92067, which sell for far more than the county's, took about twice as long on average over the last 12 months, though the data does not prove price is the cause. The October 2026 median sale price was $5,272,500 in 92067, against $1,067,500 for the county. The San Diego MLS tool does not separate price tiers within the ZIP, so it cannot show how a much pricier estate compares with the 92067 median.
Are luxury home prices dropping in Rancho Santa Fe?
The evidence is mixed. The October 2026 median in 92067 was 9.1% below October 2025, but that compares just 10 closings with 17. Over the full 12 months, the average sale price was $5,888,794 against $5,852,613 the year before, up 0.6%. The mix of homes that sell moves these figures a lot.
What percent of the list price do Rancho Santa Fe homes sell for?
Over the last 12 months, 92067 single family homes averaged about 96.2% of list, using monthly ratios weighted by closings. The county averaged about 99.6%. Monthly figures in 92067 ranged from 93% to 103%, so a single month says little.
Why does Redfin show a different days on market number than the MLS?
The two are not measuring the same thing. For September 2026, Redfin reports a median of 81 days on its Rancho Santa Fe page across all home types, while the San Diego MLS tool shows 37 days for single family homes in ZIP 92067. Check the geography, property type and time period before comparing any two figures.
How many months of inventory does Rancho Santa Fe have?
About 5.3 months in ZIP 92067 by my calculation, from 73 single family homes in October 2026 and an average of 13.75 closings per month over the past 12 months. The same math gives about 2.4 months for San Diego County. Inventory can move quickly in a ZIP this small.
Zach Arrington, DRE 02135675, Real Broker, LLC
Call or text (619) 374-5339 · zach@zarealtygroup.com
This article is general information and not a promise of any sale outcome. Market figures are aggregates for the stated ZIP and are not Zach Arrington's personal sales.
Sources
- San Diego MLS market statistics (sdmls.com), ZIP 92067 from January 2024 and ZIP 92091 and San Diego County from November 2024, through October 2026, single family and condo / townhome, retrieved November 4, 2026
- San Diego MLS Support, Days on MLS vs Market Time
- Redfin, Rancho Santa Fe Housing Market, retrieved November 4, 2026
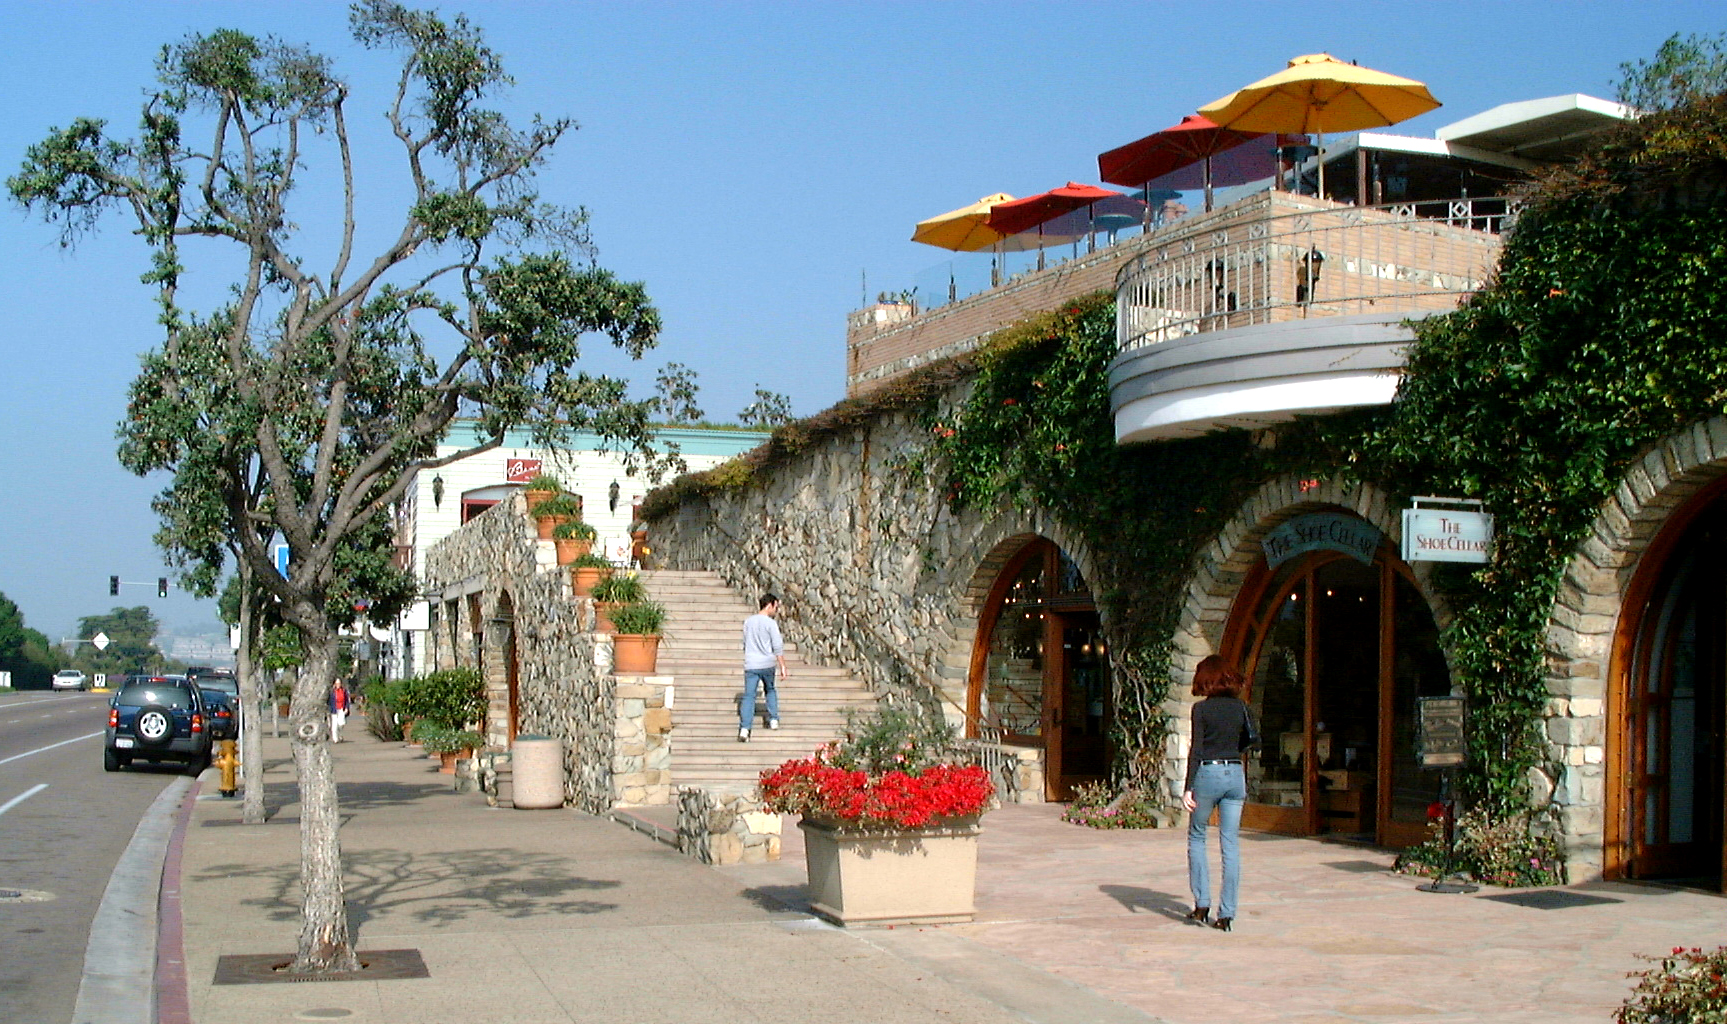
Photo: Rancho Santa Fe by mil8, CC BY 2.0, via Wikimedia Commons.
Categories
Recent Posts